|
A visual image such as a chart or diagram used to represent information or data. CLO: Students will be able to use a flat graphic to illustrate particular data using Adobe Illustrator tools. WHAT ARE YOU LEARNING? I will be able to draw using Adobe Illustrator's shape, pen & pathfinder tools. I will be able to organize data into an infographic. HOW WILL I KNOW YOU GET IT? By creating a graphic that is easy to read an full of visuals as well as valuable information. The infographic should include a list, comparison, flowchart, data, map, visual article, timeline, menu, recipe or steps to do something. WHY IS IT IMPORTANT? Today everything is on social media, most effective use of getting information out to people is through the use of visuals such as a flat graphic or ingraphic. It takes less time to read, it's quick, and people can remember the images easily. It is also easy to share on social media. REQUIREMENTS: Size: 8.5x11, 11x17 or equivalent. Medium: Adobe Illustrator CS6 VOCABULARY: Show me how to use: pen, shape tool, stroke & fill tools. Text, fonts, color should be a focus based on target audience. Put your name on a piece of paper. Number and write answer.
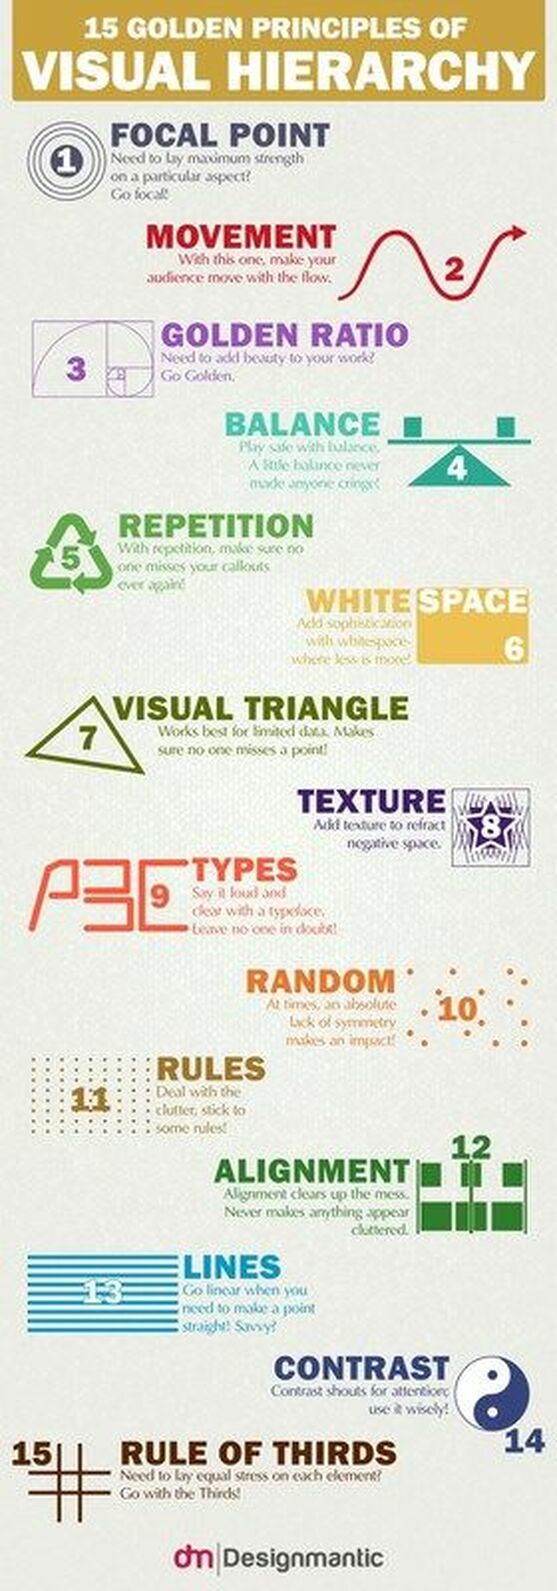
RULES TO A GOOD Infographic
0 Comments
|
